RC-APC runs a model of your process against live data, finds the optimum as it moves, and adjusts your DCS, PLC or SLC setpoints in real time to hold it there.
Protein gelation, surimi to crab stick
The optimum is in the bowl, not on the certificate.
A gel strength grade tells you the paste was strong eight months ago, in another country.
The cutter can tell you what it is now.
Module 1
The optimum in the bowl.
Whatever surimi arrives.
Whatever starch.
Whatever water.
RC-APC makes the best crab stick those three can make.
Every batch. Not the average batch.
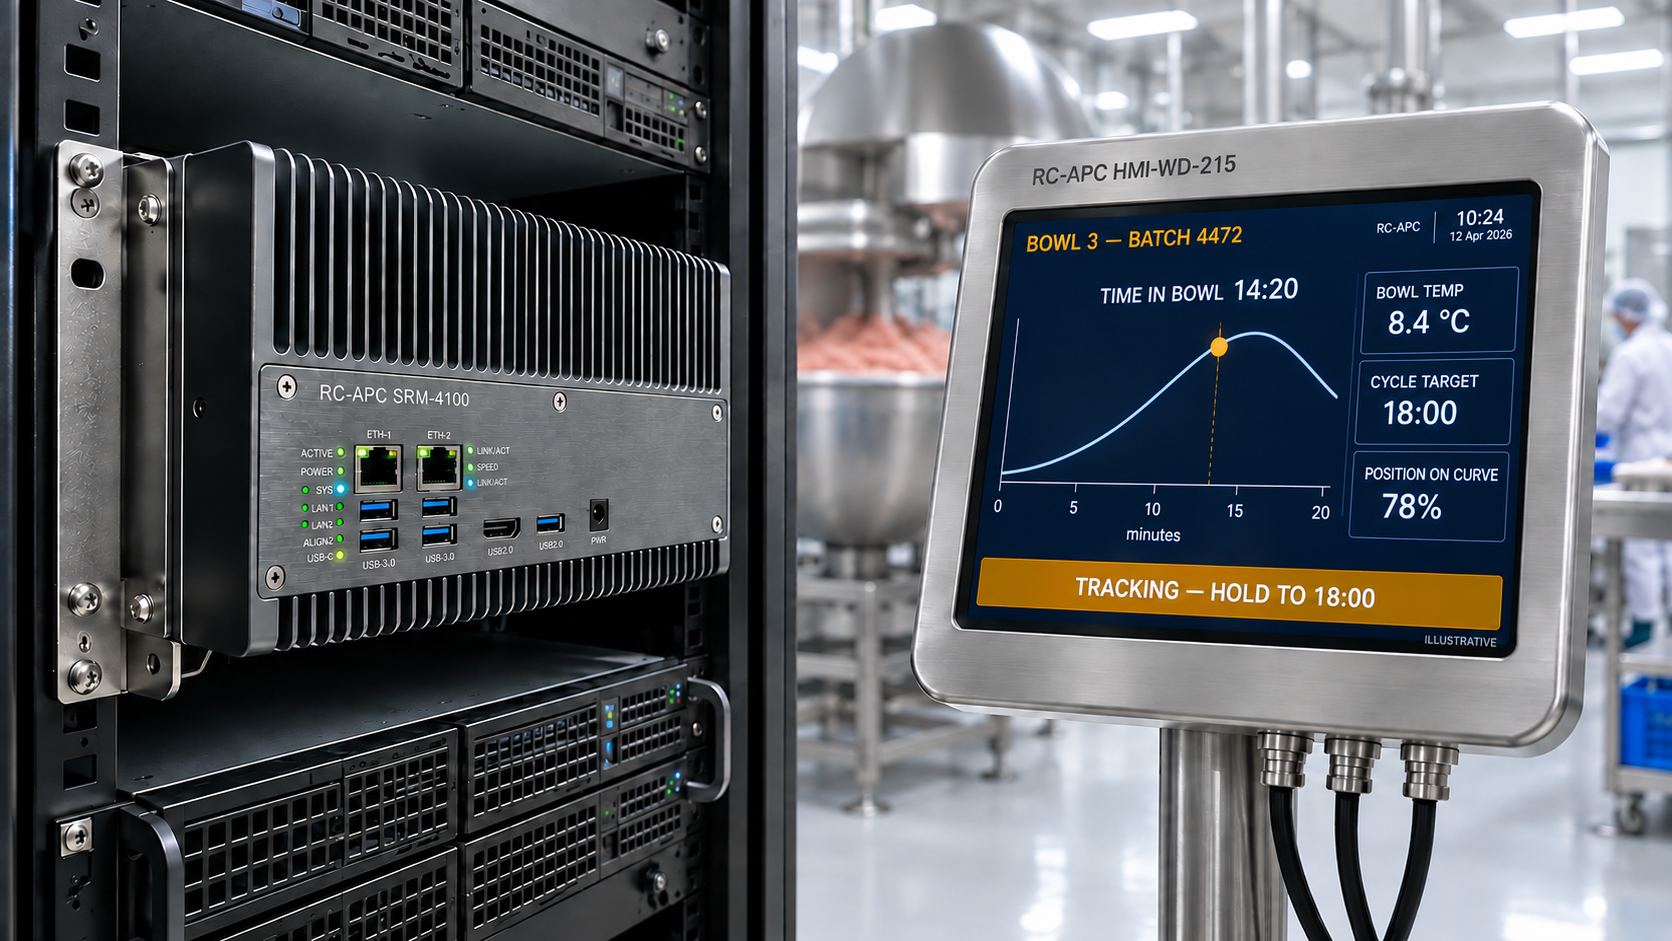
A system and a washdown panel your operators use, not a report. Fifteen inch IP69K stainless steel washdown HMI on a stainless pedestal stand, rated for line washdown. The Module 1 screen during a batch: where the paste is on its own curve, live, while the cutter runs. Indicative interface, figures illustrative.
Proposal stage. No deployment yet in this application.
One setting cannot be right for three different pastes. The weakest is run past its point; the other two are stopped short of theirs. The timer sits early for most of the lots a plant sees, because over-chopping shows as a visible defect while under-chopping is a silent loss, and that asymmetry is the same one that puts prime product into the intermediate cut on a distillation column.
Your operator already knows the lots differ. He changes the recipe when he judges one to be weak, and he is right to. He does it by eye, once, for the lot, rather than by measurement, on every bowl.
The whole cycle is a few minutes, and the window near the top of the curve is shorter than that, which is why a timer set for the average lot is wrong for most of them.
All curves are illustrative. How large the gap is on your line, on your surimi, is what RC-APC would measure from your own data.
Two curves, and they do not stay together.
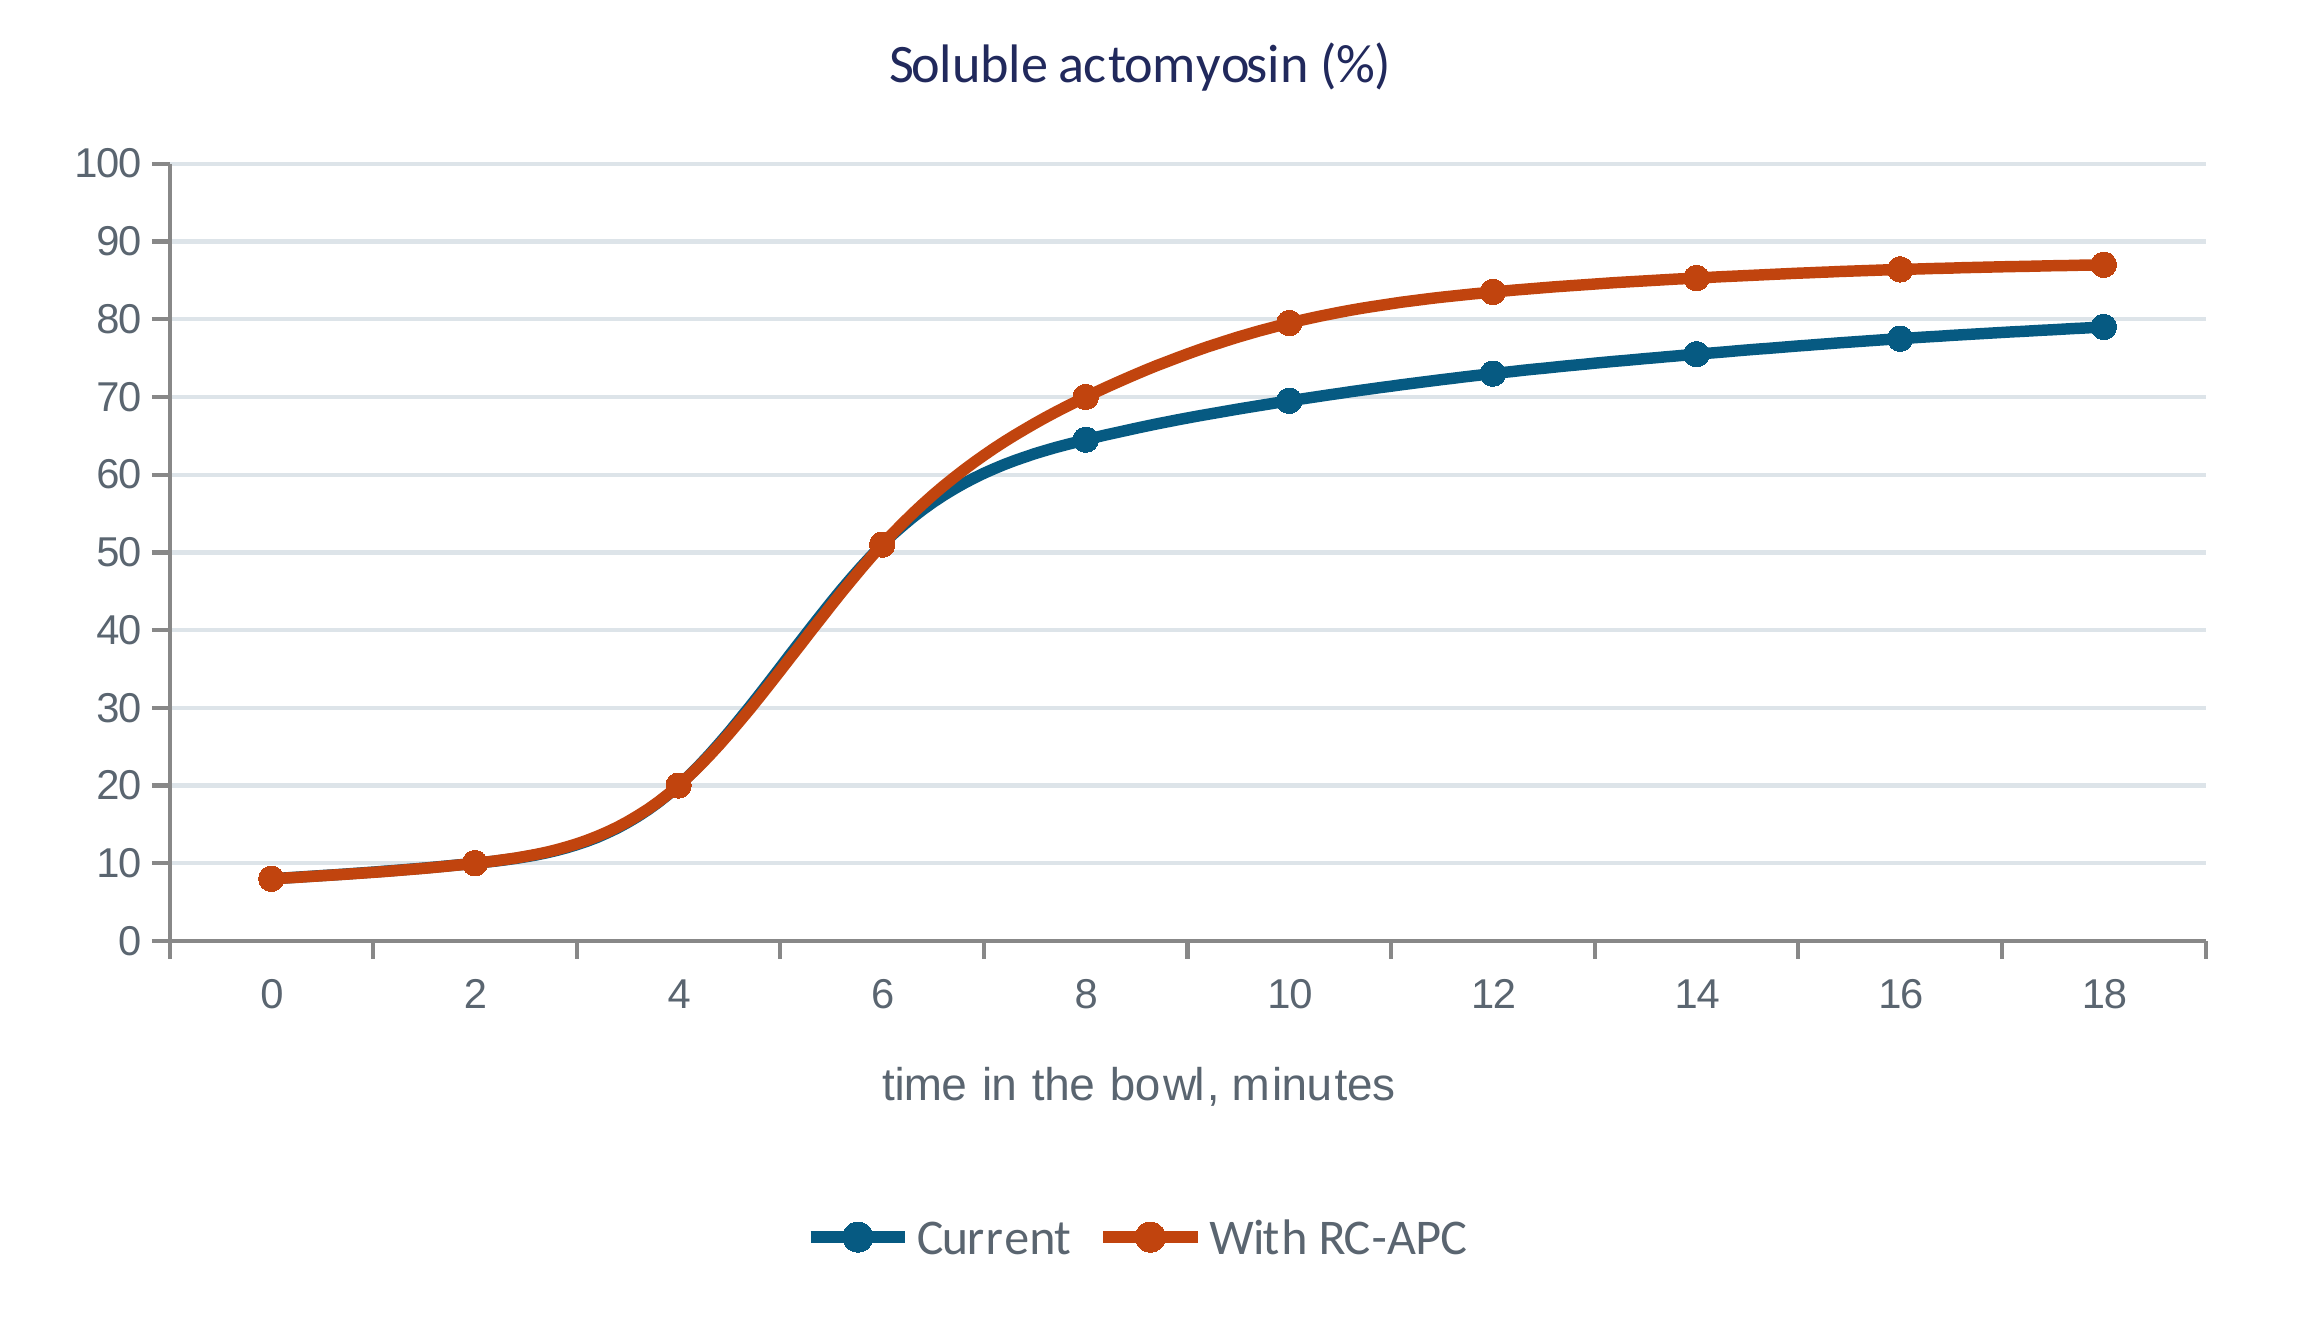
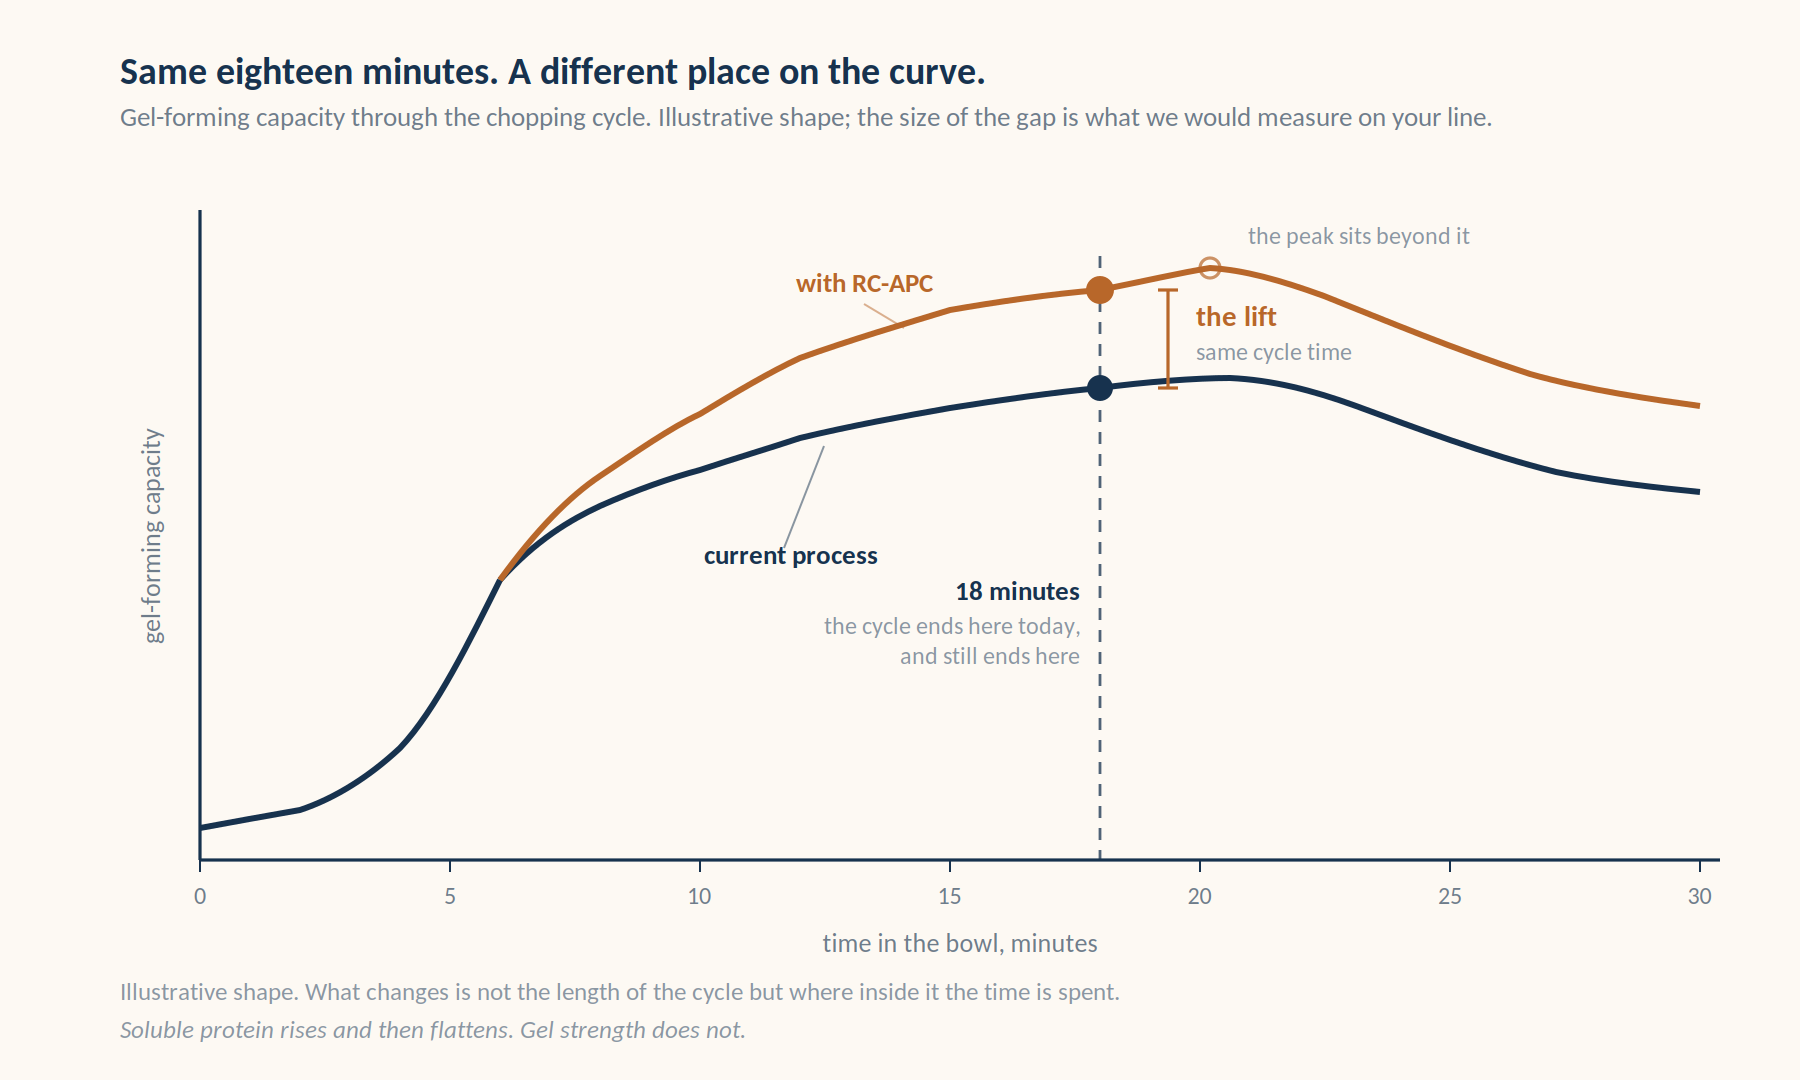
Soluble actomyosin, on the left, rises through the cycle and then flattens. Gel-forming capacity, on the right, which is the thing you are actually selling, rises, reaches a maximum and then declines.
Gel-forming capacity through the chopping cycle. The cycle currently ends at eighteen minutes and still ends there. What changes is where on the curve that endpoint falls.
The two part company
Once solubilization flattens, more time in the bowl is no longer buying protein into solution. It is still buying shear and heat, and gel-forming capacity has a maximum that solubilization does not. Past that maximum you give back what you gained.
So running it longer is not the answer
The divergence between the two curves is why. And the maximum moves from batch to batch, so reaching it is a measurement problem rather than a new setting.
The saving is not fewer minutes in the bowl. The cycle stays where it is. Time and temperature are redistributed between the stages inside it, so that the same eighteen minutes lands higher on the curve. No throughput is given up.
RC-APC finds the optimum in every batch. Then holds it there.
The peak moves from lot to lot, and from batch to batch within a lot. A fixed setting cannot follow it, and neither can a smarter fixed setting. Following it is a measurement problem, solved on the line, while the cutter runs.
What it does
Tracks where the paste is on its own curve, live, through the cycle, and calls the endpoint for that batch rather than for the average batch. No gel strength figure is required and no incoming parameter is used. Nothing new goes into the bowl: no probe, no sampling, no analyzer, nothing in contact with the product, nothing extra to clean or validate.
What the operator sees
A washdown panel at the line showing the batch in progress, where it sits on the curve, and the endpoint it is heading for. Beside that, the last texture result from your laboratory and the running difference between the two. Every move RC-APC makes is on the screen with the reason for it, and logged.
What checks it
Your texture analyzer, and your fold and cook tests, exactly as they are run today. They stay the reference and they stay the arbiter. RC-APC works between your laboratory results and is measured against them each time one arrives. The bias between the model and your bench is on the screen, not in a report you would have to ask for.
Module 1 requires no gel strength figure. None.
It does not read the certificate. It does not estimate the certificate. It does not care how old the certificate is, which plant issued it, or how long the pallet sat in cold storage on the way to you.
RC-APC is Rheo-Cognitive Advanced Process Control: the same engine as TC-APC, which ran the carbonation towers at Saurashtra Chemicals, reading a process through its Rheology Model instead of its thermodynamics.
The machine you already have is generating the signal together with the thermal history of the batch. RC-APC reads it.
This module needs nothing from anybody. It can start on your line without a single change to purchasing, incoming inspection or your supplier relationship.
Three reasons the obvious approach does not work.
Anyone who has thought about this seriously raises these three. All three are correct. So we changed the approach until none of them mattered.
01
There is no instant analyzer
Nothing on the market measures gel strength on incoming surimi in the time available before the cutter. There is no shortcut here.
02
Prediction on prediction compounds error
Predicting gel strength from a certificate, then predicting a stop time from that prediction, stacks two errors on top of each other.
03
An old certificate cannot describe today's pallet
It was measured at manufacture. Since then the protein has aged and enzyme activity has moved. The number on the paper is not the number in the bowl.
So we do not predict. We detect.
If we predict
The obvious approach
Estimate the gel strength G, compute a stop time t*(G) from it, stop there.
e1 = | dt*/dG | × e2
An error e2 in the incoming estimate passes straight through into the stop time, multiplied by how sensitive the stop time is to gel strength. Error in, error out.
We detect instead
What RC-APC actually does
Read the signal the machine is already producing, and the thermal history beside it. Stop when the paste is where it should be on its own curve.
e2 does not appear
There is no gel strength estimate to be wrong about, so e2 has no effect on e1. What is left is signal noise in the bowl, which is something we can measure on your line. The cutter runs the assay on every batch, every day.
Module 2
Dynamic least-cost formulation.
A separate module, with a separate precondition. It is about the most expensive thing in the bowl.
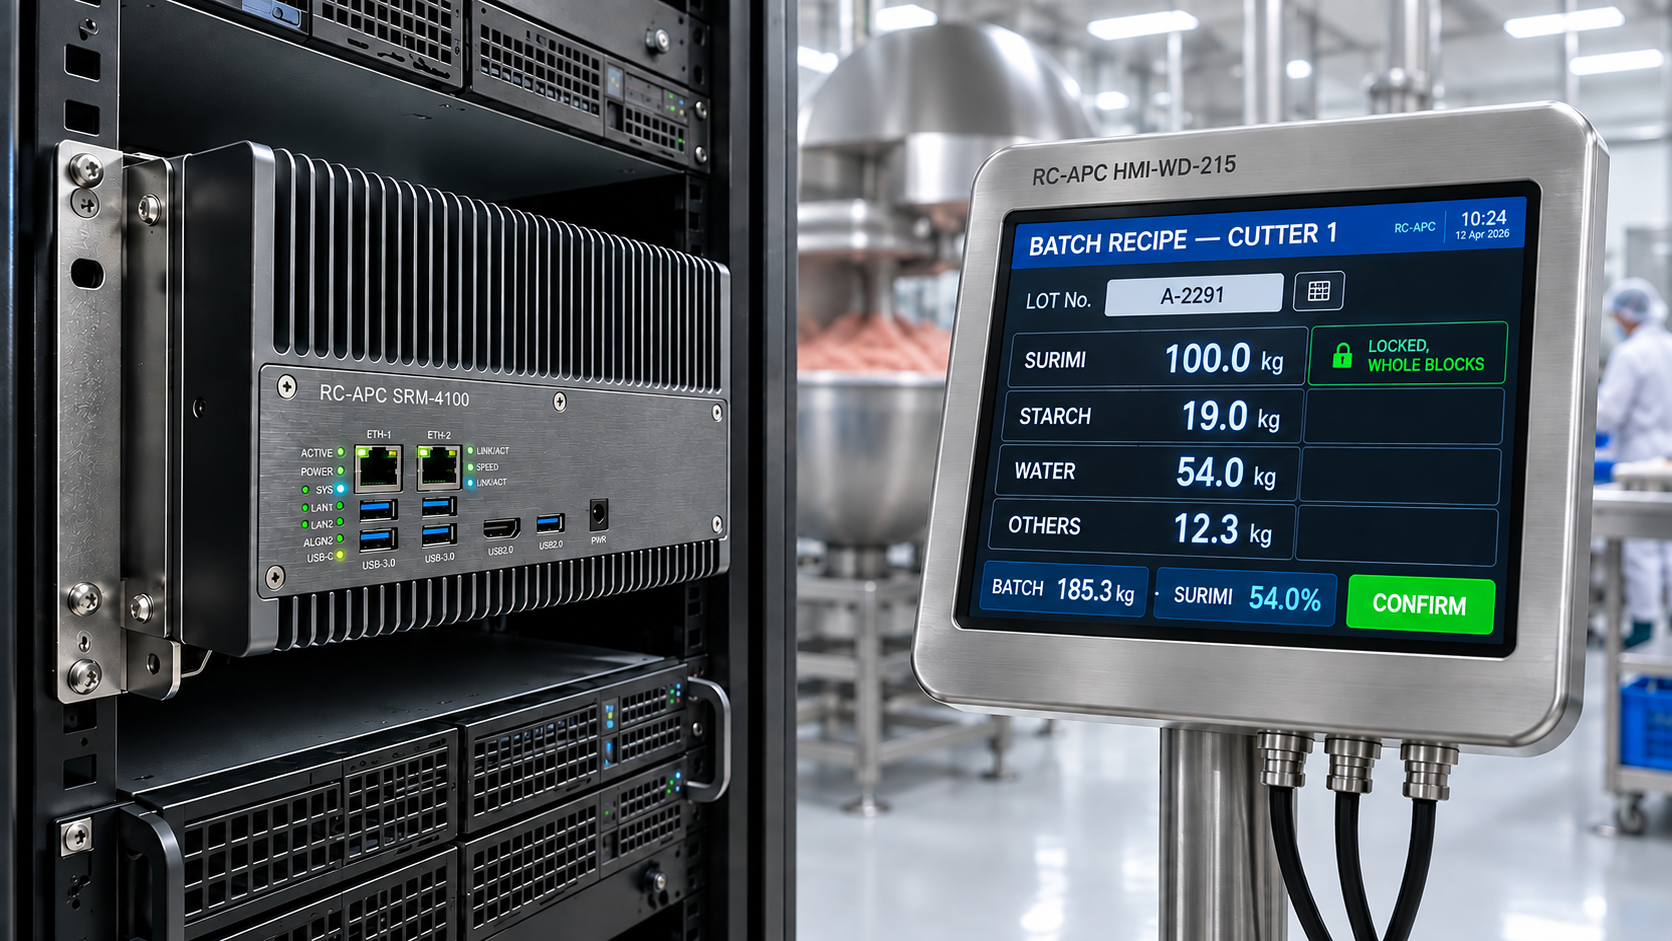
Surimi is the costly ingredient. Starch, water and the rest are not. How much protein goes into a batch is therefore a direct margin decision, and it is currently made once, conservatively, and held.
It is held conservatively for a good reason. When you cannot tell what the paste will do, you formulate so that the worst batch still passes. That buffer is not waste born of carelessness. It is insurance against variability you cannot currently see.
We do not lower the bar. We help you land right on it.
The first gain is consistency, not a cost saving. Land the same average with less scatter and the worst batch improves.
Same average. A better worst batch. Consumers remember the worst one they ate.
Illustrative shapes, not a result. How much the spread narrows on your line is something only your own data can show.
Then the saving becomes a choice rather than a gamble. Once the spread is narrower, you can keep the quality gain, take the protein saving, or split the difference. The model supports every setting on that dial. Where the average sits is a business decision, not a technical one.
Protein and starch compete for the same water.
In a low-surimi recipe they draw on one supply. The recipe sets the water for the surimi it assumed, not for the lot in the bowl. Add starch to save money and it takes water the protein needed, and the premium texture goes with it.
Module 2 sets the water for each batch, for that lot of surimi and the starch going in beside it, so the starch has what it needs without robbing the protein network your AA fold test depends on.
What Module 2 needs, stated plainly
A current parameter set for the incoming surimi. Not a certificate issued at manufacture, carried two months at sea and six in your cold store, but a figure that describes the pallet you are about to open.
Where those parameters are not available, that is the first thing to fix, and it is not a control problem. We would rather say so than sell you RC-APC to paper over a data gap. Module 1 does not depend on any of this and can run meanwhile.
It is possible that once Module 1 has been running long enough, its own accumulated observation of the bowl could estimate the incoming material well enough to serve Module 2. That is a possibility worth testing, and we would rather describe it as one than put it in a proposal.
Measuring the thing you are actually selling.
A single gel strength grade can cover two pastes that behave differently: one stiff and elastic, one that flows. Graded the same, they do not eat the same. Texture profile analysis on a texture analyzer, alongside your existing fold and cook tests, separates them into hardness, springiness, cohesiveness, adhesiveness and chewiness. That is the index the model holds, and it is closer to what your customer experiences than any one number.
RC-APC, and where the name comes from.
TC-APC, Thermo-Cognitive Advanced Process Control, reads a process through its thermodynamics. Where the variable that decides the money is mechanical rather than thermal, the same engine reads it through its Rheology Model, and that one is Rheo-Cognitive Advanced Process Control. The estimator changes. The principle does not.
What this cannot do.
It cannot improve bad surimi
If the protein has degraded, stopping the cutter at the right moment gets you the best paste that material can give. It does not get you a better material.
It cannot run Module 2 without parameters
Formulation against a quality target needs a current description of what is going in. Without it there is nothing to formulate against, and we will say so.
It does not set your quality level
The model gives you the range. Where you sit on it, between consistency and margin, is yours to decide and yours to change.
It does not replace your laboratory
Your texture analyzer and your fold and cook tests remain the reference. The model is checked against them, and the bias between the two is on the screen.
Track record
One deployment, and we say which one.
Deployed and validated
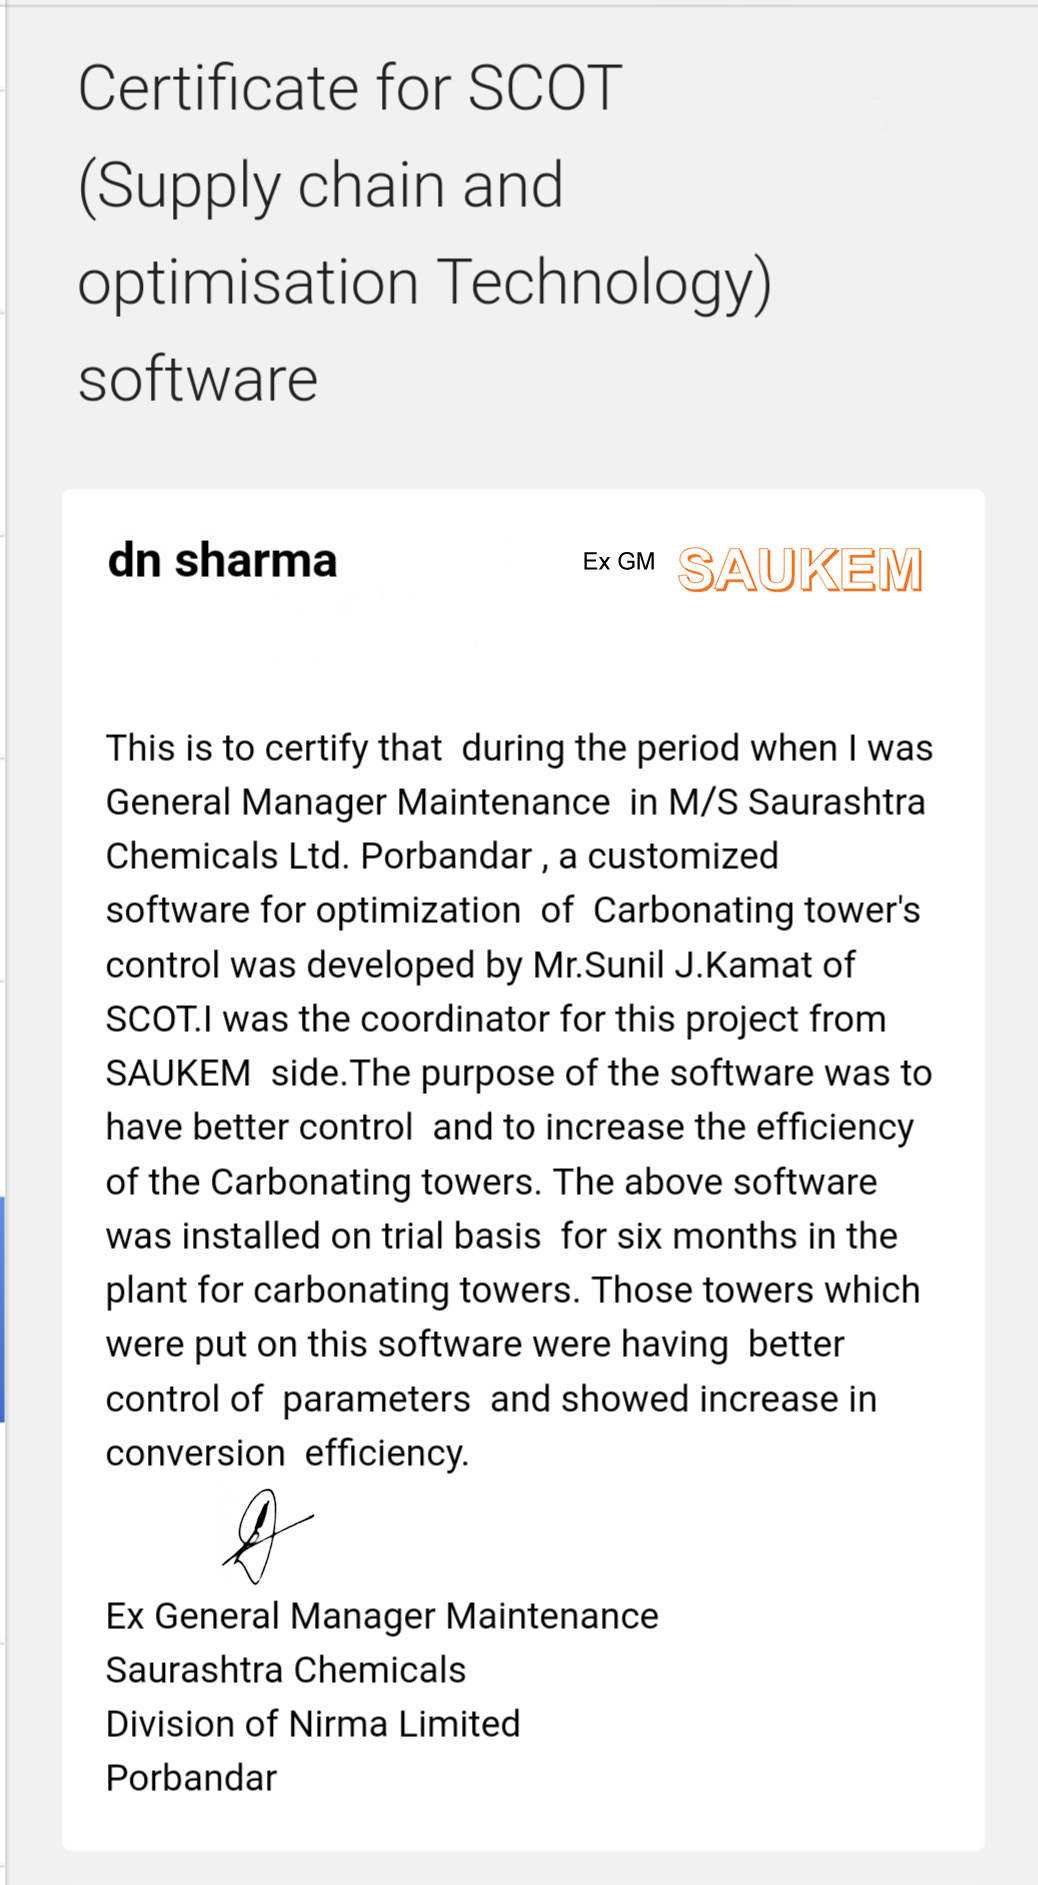
Fourteen carbonation towers at Saurashtra Chemicals, a division of Nirma Ltd, Porbandar. A hybrid thermodynamic, kinetic and physical model, solving over three hundred simultaneous equations in real time against live plant data, reading the towers through the existing control system and issuing setpoints back to it. Validated over six months of plant operation.
Those towers which were put on this software were having better control of parameters and showed increase in conversion efficiency.

D. N. Sharma Then General Manager Maintenance, Saurashtra Chemicals, a division of Nirma Limited, Porbandar. He coordinated the project and will take a reference call.
A different industry and a different estimator. What carries across is the engine, the way it sits above an existing control system, and the fact that it was run on a live plant for six months and signed off by the man who ran it.
The work was carried out under an earlier company name, which appears on the certificate.
The mark
Find the optimum. Hold it while it moves.
The curve is a yield or selectivity response. The amber point is the optimum, and the dashed drop is where it sits on the operating axis.
The second half of the line is the part that matters. Finding an optimum is a study, and studies end up in drawers. Holding one while the feed, the fouling, the weather and the wear keep moving it is a control problem, and that is the work.
Where this starts
Four answers, from your numbers rather than ours.
Give us your production data and a small window on your own line. Nothing on the line changes while we look.
1
How much are you losing?
Per batch, and per year at your volumes, with the uncertainty stated openly rather than buried inside a single confident number.
2
How much does it move?
Between batches, between lots, between recipes and between machines. The swing is often worth more than the average.
3
What is realistically recoverable?
Not the theoretical maximum. What can actually be captured on your line, under your constraints, with your people.
4
Is it worth acting on?
Including the answer no, if that is what your numbers say. You would have spent very little finding out, and you would know something about your own line either way.
A difference too small to notice in one bowl is a large number by the end of a year. We would not ask for your data if we expected the answer to be small, and we will not put a figure in front of you until it is your figure.
RC-APC Module 1 changes how the time and temperature inside the cycle are distributed. It does not change the recipe, the ingredients, or anything that goes into the bowl.
Start with your line
Send your production data and we will answer the four questions above
No charge, and no commitment either way. Your data, your laboratory, your people, and nothing on the line changes while we look.
projects@yielddynamics.in Talk to IIT Bombay engineers Call +91 94230 07004Monday to Saturday, 9:00 to 19:00 IST
Or read how it is deployed
It writes setpoints only after you have watched it be right
Tuned offsite, then run in shadow mode on your live line until it tracks your own measurements inside a tolerance you set. Only then does it act.