Thermo-Cognitive Advanced Process Control (TC-APC) models, simulates and optimizes your process in real time to improve yield, conversion and throughput, and reduce energy use, with a quick payback.
Plant Ledger, the whole plant
A log sheet tells you what was made. It does not tell you what was lost.
Every shift report adds up, because it was written to.
Whether the plant adds up is a question nobody is asking.
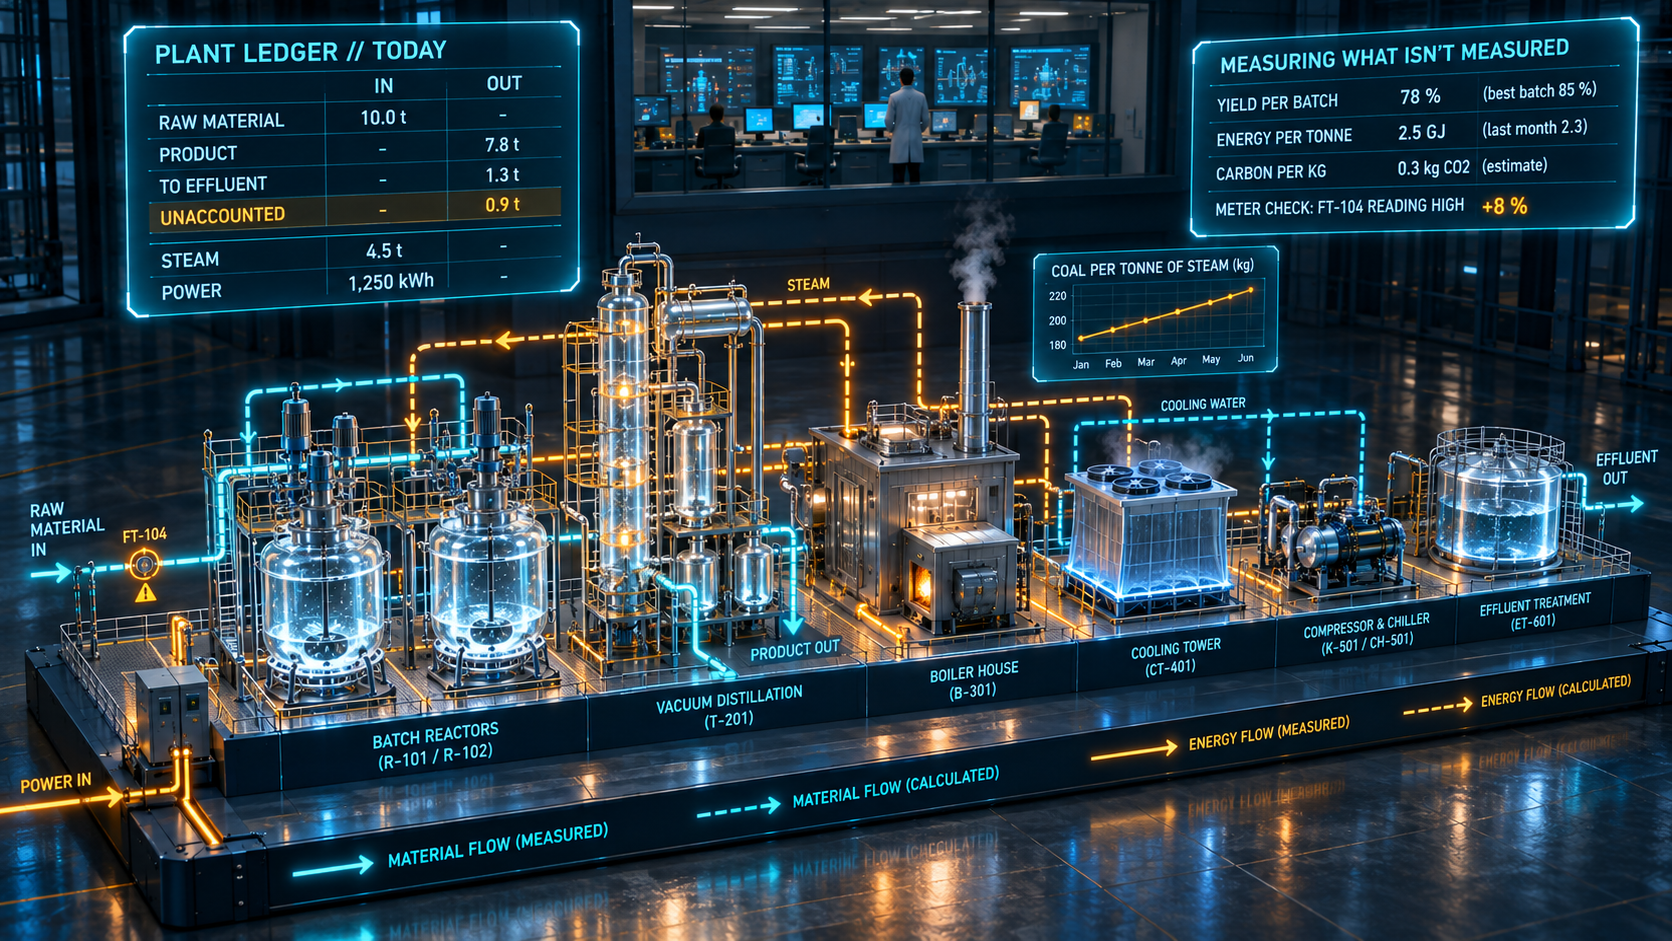
What Plant Ledger sees, drawn as if the plant were transparent. Representative plant, indicative values. The ledger shows what came in, what left as product and effluent, and what is unaccounted for. Solid lines are measured flows, dashed lines are calculated ones. The feed meter flagged in amber is reading high, which is part of the gap.
Engineering proposal.
What a log sheet cannot do.
Log sheets show output, not losses.
The log sheet is not the problem. It records what was read, when it was read, which is what it was designed to do. Three things were never its job, and all three cost money.
01
It does not balance
Raw material in, product out and whatever went to effluent sit on different sheets, written by different people. Nobody adds them across, so the gap between them is never seen.
02
It trusts every meter
A reading is written down whether the meter is right or drifting. A flow meter that has read high for a month looks exactly like one that is correct.
03
It arrives after the shift
By the time the sheet is read, the batch is finished, the fuel is burned and the effluent has gone. It explains a loss that can no longer be prevented.
This is the same problem as every other application on this site, at the scale of the whole plant. The quantity that decides the money is not measured, so it is not managed.
What Plant Ledger adds
See the plant. Understand it. Then act.
A typical plant dashboard shows what happened. Plant Ledger works a level above it: it balances the plant, works out from the physics what no instrument reports, and acts on it where you choose. Every module below is an option. Start with one area and add the rest when they have earned their place.
See: the plant, recorded as it runs.
The plant record
A typical plant dashboard shows tags and trend lines, and the shift report is still written by hand.
Plant Ledger connects every unit and machine through its existing DCS, PLC or SLC, records production, downtime and energy as they happen, and writes batch and shift reports without a log sheet.
The 8 a.m. message
A typical plant dashboard waits to be opened, and usually is not.
Plant Ledger sends yesterday's yield, losses and energy per tonne, and the one thing to fix today, to the owner's phone by eight, on WhatsApp or by email. A message gets read.
Understand: measuring what isn't measured.
The plant's balance sheet
A typical plant dashboard shows each meter on its own, so nobody sees whether the plant adds up.
Plant Ledger balances every batch: yield, energy per tonne, and what left in the effluent rather than in the drum. Once a month it puts the whole plant on one page, laid out the way a balance sheet is. Promoters read balance sheets every year. Few have seen one for their plant.
Physics readings
A typical plant dashboard shows a blank where there is no instrument, or where the instrument has failed.
Plant Ledger fills the blank with a physics reading: a value no instrument reports, such as the composition on a tray, the yield of a batch still running or the organic load in a drain, worked out from the readings around it and shown live, marked as calculated.
Meter check
A typical plant dashboard shows a drifting flow meter's number exactly as it shows a correct one.
Plant Ledger checks every meter against the mass and energy balances and ranks them by how well they agree, so maintenance checks the most suspect meter first, between scheduled calibrations.
Early maintenance warnings
A typical plant dashboard raises an alarm once a limit has been crossed, or asks for new sensors to do better.
Plant Ledger warns early from the instruments already installed: a condenser fouling, a vacuum system leaking, a pump or compressor losing efficiency, a boiler using more fuel for the same steam.
Effluent early warning
A typical plant dashboard records the effluent after it has left.
Plant Ledger works out the organic load leaving each unit from the balances, warns before a discharge limit is crossed, and keeps a record showing the plant was watching.
Hidden capacity
A typical plant dashboard shows how busy each unit was.
Plant Ledger shows which unit limits the plant's output, and what relieving it is worth, before anyone signs for a new column.
Carbon per kilogram
A typical plant dashboard leaves emissions to a yearly estimate.
Plant Ledger gives emissions per kilogram of product from the same energy balance. The largest listed companies already report energy and emissions per unit of output, and are beginning to ask their suppliers for the same figures.
Physics first, statistics second
A typical analytics platform feeds large volumes of data into general-purpose learning models, which can find correlations that are not real.
Plant Ledger uses a model that obeys the same laws as the plant and learns from data only what physics cannot tell it. So it does not find correlations that cannot be true, and it stays sensible beyond the data it has seen.
Act: the loop closed, where you choose.
Utilities first
A typical plant dashboard shows what the compressors, chillers, cooling towers, pumps, fans and boilers consumed.
Plant Ledger adjusts their pressure and temperature setpoints to what the plant actually needs, instead of the fixed, cautious values they usually run at. The saving shows on the power bill, no product quality is at risk, and it is the safest place to start.
Power bill guard
A typical plant dashboard shows the peak after the bill has arrived.
Plant Ledger moves flexible loads out of peak tariff hours, such as chillers pre-cooling or compressors filling their receivers, and holds maximum demand under the contracted limit.
Process units
A typical plant dashboard leaves the setpoint where the recipe put it.
Plant Ledger hands over, once its numbers have been trusted for long enough, to TC‑APC, which holds process units at their optimum, and RC‑APC, which does the same for pastes and gels. Both write setpoints back within the limits you set, with the reason for every move on the operator screen.
Savings on your own meters
A typical plant dashboard cannot show a saving, because it does not change anything.
Plant Ledger measures every saving on your own meters, before and after, so the result is yours to check.
Machines and discrete lines have their own engine, MC‑APC, described below.
One industrial system. One ledger. Three engines.
What arrives on site
One industrial system, beside the controls you already have.
- ReadsFlows, levels, temperatures, pressures, weights, energy meters and machine states, over OPC‑UA or Modbus from your existing DCS, PLC or SLC. Where a reading exists only on paper, it is entered once a shift until an instrument takes over.
- ShowsOne screen at the panel, and the same live view on phones and tablets on your own network, so the operator, the shift engineer and the plant head are looking at the same numbers and the same reasons. Nothing is published outside the plant.
- CalculatesThe balances, the estimates and the warnings, on its own machine inside the plant, so nothing in your existing control logic is modified.
- Stays in the plantScreens and reports run on your own network and keep working when the internet does not. Nothing leaves the site except what you choose to send, such as the morning message.
- WritesNothing, until you choose a closed-loop module. Then only the setpoints you approve, within limits you set, with every move and its reason on the operator screen.
- GuardrailsHeartbeat watchdog and rate‑of‑change limits held in your own system. On any timeout or implausible estimate, control returns to your existing setpoints.
- Before it writesRun in shadow mode on your live plant, writing nothing, until its figures track what the plant actually did, for as long as you want to watch it.
What this cannot do.
It cannot balance what no instrument touches
A stream with no meter, no level and no weight on either side of it cannot be balanced. We will say which streams those are, and where one instrument would close the gap.
It does not replace the laboratory
Calculated values are estimates, and the screen says so. The laboratory result remains the reference they are checked against.
Its warnings need your plant's history
An early warning means something once the ledger has learned how your plant normally behaves, and that takes a few weeks of running.
Carbon is calculated, not certified
Emissions per kilogram come from your fuel and energy data with standard emission factors. They support a sustainability report. They are not a certified audit.
The power guard moves only what you allow
It shifts only the loads you have marked as flexible, and only within the limits you set. Process loads stay exactly where your operators put them.
It does not touch safety
Interlocks, trips and the safety system stay under their own logic, and nothing in this system writes into them.
Machines and discrete lines
IIoT that closes the loop.
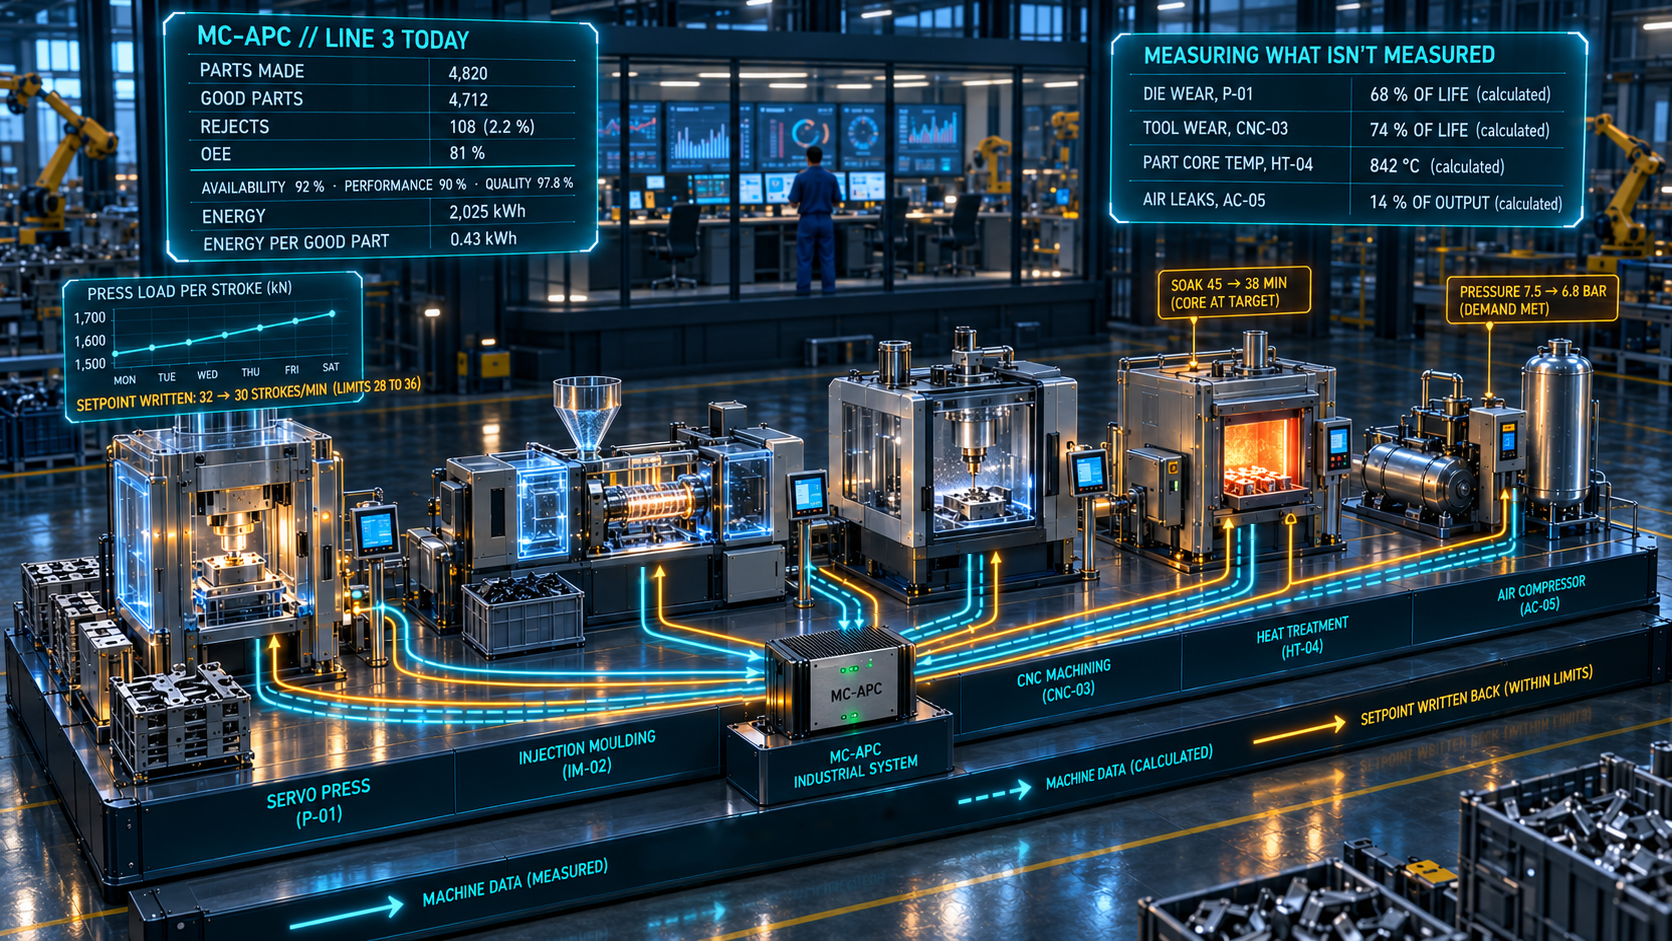
What MC‑APC sees on the line, and what it writes back. Representative line, indicative values. Cyan lines carry measured and calculated machine data to the MC‑APC industrial system. Amber lines carry setpoints back to each machine, within its limits.
We don't just report the data. We act on it.
Most IIoT platforms stop at description: what happened a few minutes ago, shown on a screen. MC‑APC works a level above that. It works out what should happen next from the machine's own physics, and closes the loop to make it happen, writing setpoints back to the PLC in real time so that a defect is prevented rather than reported. The MC‑APC engine runs on the industrial system beside the machines. Every item below is a module: pick the ones your line needs.
Closed-loop control
A typical IIoT platform reads the PLC and puts a warning on a screen: motor load too high, operator please fix.
MC‑APC works out the correction and writes a new setpoint back into the PLC in real time, adjusting feed rate or tension within approved limits before the problem reaches the part. Safety interlocks stay under their own logic.
Physics readings
A typical IIoT platform shows a blank when a sensor fails, or when a value such as a material's viscosity or a part's core temperature is too hard to measure directly.
MC‑APC works the value out from the physics of the readings around it, such as pressure, flow and temperature, and shows it live as a physics reading, marked as calculated. A sensor that disagrees with the physics is flagged.
Wear-aware tuning
A typical IIoT platform predicts from vibration data that a die will fail in a few days, and leaves the plant to cope.
MC‑APC sees the die wearing and eases the load within approved limits, adjusting cycle time and lubrication intervals, so the die lasts until the planned weekend shutdown instead of stopping the line in the middle of the week.
Soak and cool to the core
A typical IIoT platform shows the furnace or oven temperature, while soak and cooling times are set long to be safe.
MC‑APC works out the part's core temperature in heat treatment furnaces, paint- curing ovens and molding cooling, and ends the soak or the cooling when the core is ready rather than when a fixed timer runs out.
Utilities first
A typical IIoT platform shows what the compressors, chillers, pumps and fans consumed.
MC‑APC holds compressed air, chilled water and cooling at what the line actually draws, estimates air leaks while the line runs, and lowers the settings when demand allows. The saving shows on the power bill and no part quality is at risk, which makes it the safest place to start.
Physics first, statistics second
A typical IIoT platform feeds large volumes of cloud data into general-purpose learning models, which can find correlations that are not real.
MC‑APC uses an engine that obeys the same laws as the machine, the laws of heat, flow and mechanics, and learns from data only what physics cannot tell it. So it does not find correlations that cannot be true, and it stays sensible beyond the data it has seen.
The reason for every move
A typical IIoT platform gives a score or an alarm without saying why.
MC‑APC puts every setpoint change on the operator screen with the reason and the readings behind it, and sends the same view to the tablets and phones of the shift engineer, maintenance and the plant head, on your own network.
Shadow mode first
A dashboard never writes anything, so it never has to prove itself.
MC‑APC writes setpoints only after you have watched it be right. It runs alongside the line in shadow mode for as long as you want to watch it.
Runs inside the plant
A cloud dashboard goes dark when the internet does.
MC‑APC runs on the industrial system inside the plant, beside the machines, and keeps controlling when the connection drops.
Savings on your own meters
A dashboard cannot show a saving, because it does not change the numbers.
MC‑APC measures every saving on your own meters, before and after, so the result is yours to check.
IIoT, with the physics in it.
Start with your log sheets
Send one month of log sheets from one area
Photographs are fine. We will show you what the area is losing between the lines, which meters disagree with the physics, and what that is worth, with the uncertainty stated openly. Including the answer that there is nothing worth pursuing. No charge, and no commitment either way.
projects@yielddynamics.in Talk to IIT Bombay engineers Call +91 94230 07004Monday to Saturday, 9:00 to 19:00 IST
Or start with one unit's data
If you already keep a historian
Send three months of operating data from one unit, with the laboratory results beside it. The same exercise, done faster, with the same honest answer at the end.
The mark
Find the optimum. Hold it while it moves.
The curve is a yield or selectivity response. The amber point is the optimum, and the dashed drop is where it sits on the operating axis.
The second half of the line is the part that matters. Finding an optimum is a study, and studies end up in drawers. Holding one while the feed, the fouling, the weather and the wear keep moving it is a control problem, and that is the work.